Background
I was learning statistics with Python and needed a dataset I'd actually enjoy working with. The Pokémon dataset — 890+ Pokémon through Generation VIII, compiled by Mario Tormo Romero on Kaggle — covered types, height, weight, and six battle stats for every Pokémon and its regional varieties.
What made it a good learning exercise was that I already had prior knowledge to test against. Findings I couldn't verify from game knowledge alone felt genuinely surprising.
Pokémon through the generations
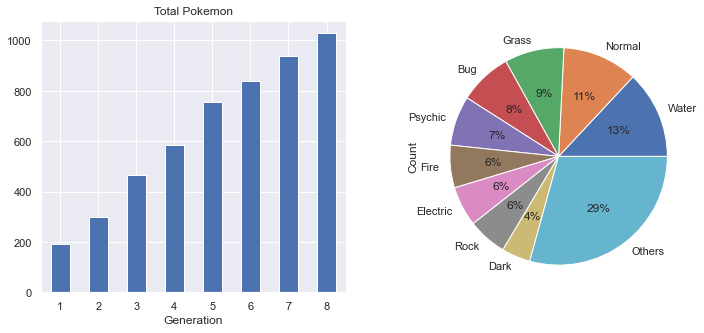
Generation I (1990s) through Generation VIII (2019–20). The dataset has more than 890 entries because regional varieties like Meowth and Alolan Meowth share a Pokédex number but count as separate rows.
Height, weight & BMI
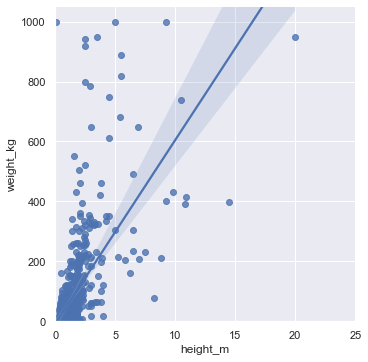
The scatter plot shows a positive correlation between height and weight — expected, and consistent with what we'd see in real animals. But there's a clear outlier: near-zero height, 1000kg weight.
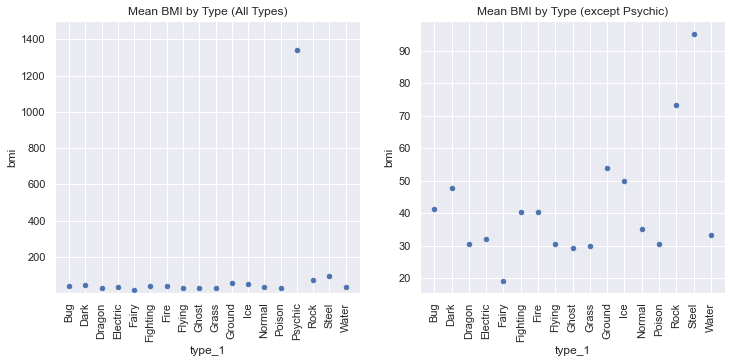
With the Psychic type excluded (dominated by Cosmoem's extreme BMI), the BMI distribution by type shows something coherent: Steel and Rock types are the densest, Fairy types the lightest.
Battle stats
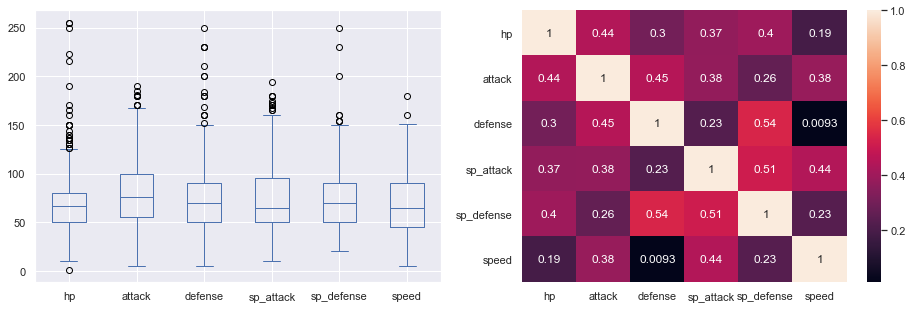
The six battle stats — HP, Attack, Defense, Special Attack, Special Defense, Speed — all correlate positively with each other, but weakly to moderately. The strongest relationship is between Defense and Special Defense (r = 0.54). Speed and Defense show almost no correlation, which makes sense intuitively: fast Pokémon tend to be fragile.
Looking at the highest-rated Pokémon per stat:
| Battle Stat | Highest Rated Pokémon |
|---|---|
| HP | Blissey |
| Attack | Mega Mewtwo X |
| Defense | Eternatus Eternamax |
| Sp. Attack | Mega Mewtwo Y |
| Sp. Defense | Eternatus Eternamax |
| Speed | Deoxys Speed Forme |
What I took from it
The real takeaway was how much faster analysis goes when you already know the domain. I could spot anomalies immediately because I knew what the data should look like. Cosmoem's BMI wasn't a data error; it was a signal worth investigating.